Adobe Scout gives you a ton of beautiful data to look at, but interpreting it isn’t so straightforward. This post will take a peek at what kind of data Scout gathers behind the scenes and how it creates all the pretty pictures, so you can more easily grok just what’s going on. (Or to put it more plainly, I recently wrote an ADC article on Scout’s custom telemetry APIs, and this post covers a few things I learned while writing it but didn’t include in the article.)
The absolute basics:
When you start a profiling session Flash opens a socket connection to Scout and sends down a bunch of data. Most of the data that winds up represented in Scout’s main panels is the names and timing details of a bunch of defined activities. (Besides activities there are also trace statements, Stage3D commands and textures, and some other things.) Scout parses all those activity details and whips them into easily (?) understandable charts and graphs.
Activities
By “activity” Scout means a block of time devoted to a given functionality. Activities in Scout have the following features:
- Each one has a name, a start time and an end time. Some activities also have other parameters.
- Activities are nested. If Activity A starts before Activity B and ends afterwards, Scout considers B to be a child activity of A.
- Based on the timing data it gets, Scout calculates a total time and a self time for each activity.
- Total time is just the period between the activity’s start and end.
- Self time is the time spent on that activity but not its children. In other words, an activity’s self time is it’s total time, minus the total times of its immediate child activities.
If you’ve looked at Scout’s custom telemetry APIs, activities are essentially the same thing as custom span metrics. There are some small differences in how they’re handled but nothing that concerns us here.
Concrete example
Suppose that Flash sends* the following sort of data to Scout:
Name Start End |
Scout will then parse this into self/total times as follows:
Name Self time Total time |
As you can see, the nestedness of parent/child activities is inferred from timing. Incidentally if you use the custom span metric API to define activities that don’t nest (e.g. B starts during A but ends afterwards), viewing the data in Scout will generate an error or just not display. So when defining your own nested metrics, be careful to end them in the reverse order that you started them.
Note: to be absolutely precise, Flash doesn’t send Scout start and end times for each activity, but end times and durations. The result is the same though.
Interpreting the data
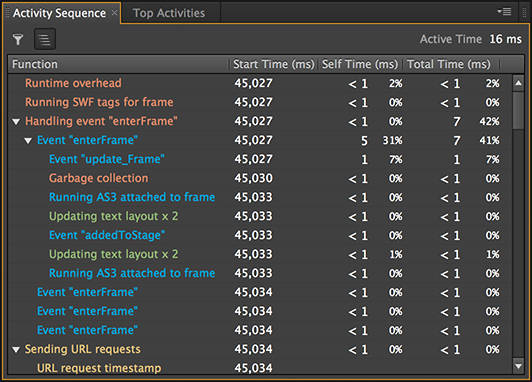
With the previous explanation in mind, the data that shows up in Scout should now be a little easier to interpret. First, in the Activity Sequence panel, all the activities Scout knows for a single frame about are listed up, with their nested relationships intact:
You can even see each activity’s start time, though that’s usually not useful so it’s turned off by default. (Right-click the column titles to change which ones are visible.)
(Incidentally, Scout normally filters out any activity that would have a total time of less than 0.5ms. To toggle this behavior click the “Hide small items” button, at the far upper left in the image above.)
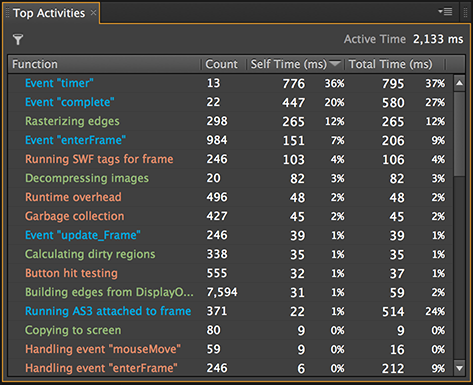
The Top Activities panel, on the other hand, ignores the activities’ start times and nesting relationships so that it can show aggregate data over multiple frames. Now multiple instances of the same activity are grouped (by activity name) rather than showing up multiple times as in the sequence panel, so Scout gives a count of how many times they occurred during the selected span.
The data behind the two panels is identical, it’s just marshalled and displayed differently. And hopefully understanding the data behind the panels will make the implications more obvious. For example, if you invoke Flash’s renderer via APIs like BitmapData.draw(), the rendering activity will be a child of the ActionScript activity. So the only way to distinguish that rendering from general DisplayList rendering is to look in the Activity Sequence panel, where nesting is preserved. If you check the Top Activities panel, all the rendering activities will be grouped, regardless of whether Flash invoked them automatically or you did manually.
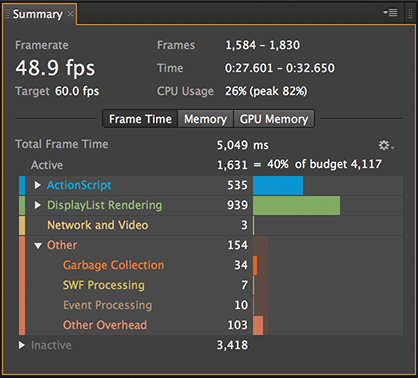
Finally, a quick note about the Summary panel:
It may not be immediately obvious but the times shown for each entry in the Summary panel are the self times of the related activity. The summary panel just groups activities into some predefined categories and displays the sum of the self times for each. (The easiest way to see which activity name belongs to which category is to just look at the colors Scout uses.)
The ActionScript panel
The data shown in Scout’s AS panel is a completely different animal from everything discussed so far. The reason being, if Flash sent an activity to Scout every time an AS3 function was called, profiling overhead would bring things to a grinding halt. So instead, Flash samples the call stack every millisecond or so, and Scout guesses what’s going on. For example, if Flash sent along data like this:
Time Call stack |
Scout can look at that and guess that FunctionC was executing for around 2ms. But whether it executed once or dozens of times during that time isn’t known, and FunctionC may have called FunctionD between two of the samples (if FunctionD returned quickly). That’s why the AS panel gives somewhat approximate results, and why you should select a long timespan of data (i.e. a large sample) if you want to get accurate results in the AS panel.
That completes our look under the covers of Scout’s data. If anything is still unclear, leave a comment or let me know on twitter!


