This is part of the CEP Mega Guide series. See also: sample CEP extension source
HTML Development
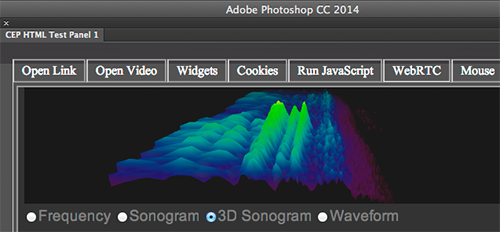
Since HTML panels internally use CEF for rendering, feature-wise they are largely equivalent to Chrome. Just like any modern browser, they support the standard web stack, including the flashy bits like WebGL and Web-RTC. To see it in action, try out this sample CEP extension, which includes a video chat demo and lots of other stuff.

So the main point here is, developing UI for a CEP extension is just like any other webdev project. There are no required tools or libraries - whatever you’d use for building a website will work.
With that said, there are a few edge cases that work differently for HTML embedded inside a panel. For example, calling window.open(url, "_blank") will open a new instance of CEF, rather than a browser window as you’d probably intend. For stuff like this where you go outside of pure HTML, it’s easiest to fall back to Node.js libraries, since there tends to already be a library for everything. For example, to open a URL in the system default browser I just used node-open. (Node.js integration is covered in part 4 of this guide.)
One other thing to be aware of is persistence. When the user closes and reopens a panel, in most cases the panel’s HTML will get reloaded. Flash is the exception here; its panels persist by default. There’s also a way to enable persistence in Photoshop - see Part 6 of this guide for details. Cookies work normally in CEP panels though, even when the tool is rebooted, so for long-term persistence that’s probably the easiest option.
CSInterface.js
Any Javascript run in your panel’s UI gets executed by a virtual machine specific to that panel. This VM is separate from the host tool or other panels, so all interaction with the host tool is done through CSInterface.js, a bridge library from the CEP team. CSInterface has APIs for:
- querying environment information (the name/version of the host tool, locale, etc.)
- getting theme info, i.e. background color. Most Adobe tools now let you select light or dark UIs, so in custom panels it’s useful to query that and set the panel UI to match.
- call scripts in the host tool’s scripting engine, and pass/receive events. For details on this see Part 6 of this guide.
To use CSInterface.js, just reference it normally in your HTML:
<head> |
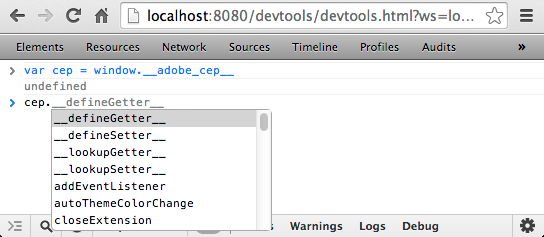
Incidentally if you peek behind the curtain, the APIs in CSInterface.js are mostly wrappers for methods found in window.__adobe_cep___, which is a special object that CEP inserts into the custom panel’s DOM. The API and details of all this can be found in the Extension SDK docs, but personally I think it’s easier to just grab the current version of CSInterface.js and look inside.
Vulcan.js
Similarly to CSInterface, Vulcan.js is another helper library from the CEP team. Vulcan allows message-passing between different extensions and different tools, as well as providing APIs to see if various tools/versions are installed, or running. Details are in Part 6 of this guide, or you could check out this sample extension.
Debugging
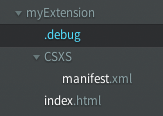
I said earlier that developing HTML for CEP is no different from regular webdev, and that’s true for debugging as well. To enable panel debugging, just create a file called .debug in the root of your extension folder, containing XML like this:
|
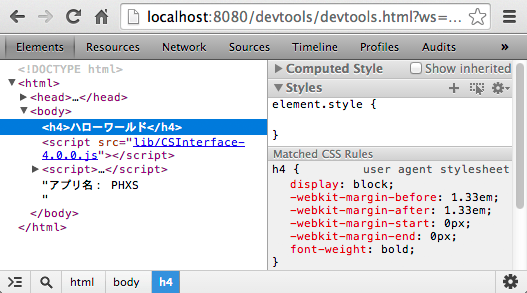
The ID should match the Extension ID in your manifest (not the ExtensionBundleID, notice), while the host name specifies which tool you’re testing in. Once that’s done, just reboot the host tool and browse to localhost on the port you specified. (So for this example, I’d open localhost:8080.) This should get you a debug console:
Using the console is basically the same as Chrome’s built in inspector - you can view and edit all the source, use the JS console, etc. You can use this for normal HTML debugging, but it’s also very useful for poking around the CEP internals. For example, to see what methods exist in window.__adobe_cep__ :
If debugging doesn’t seem to work, check that the panel is open, and that you have the same Extension ID tag in both the manifest and the debug file. Also note that only one panel/tool can be debugged per port (but you can debug multiple targets if you declare different port numbers).
And that’s everything I know about HTML dev for custom panels! Next up will is Part 4: Working with Node.js.